
HP1100 NTU Psychology Statistics: Module Review (Variable Types)
Statistician turned Data Scientist with a Psychology background. I create clear, practical content that makes statistics easy to understand.
Note: this post is part of a series of posts regarding HP1100 (Fundamentals of Social Science Research)
We previously left off at defining some basic terminology of research. In this post, we will learn more about how the various variable types, and how to properly choose a measurement of it.
Variable Types in Research
The are numerous ways to classify your variables — but perhaps one of the most important ones is the distinction between categorical vs continuous variables.
Categorical variables are groupings — whereby intermediate “values” between the group does not really make sense. Typically examples include sex (male/female), ethnicity (chinese/malay/indian), university major (psychology/math/chemistry) etc etc.
Continuous variables are ones where there is a scale — people can range from low to high in extroversion, GPA can range from 0 to 5, height can range from 0 to 2 meters (or possibly more). Point being, these are variables where the scale is continuous — people don’t belong to distinct groups as they do with categorical variables.
Espeically for Psychology, the variable type is not entirely a function of the “intrinsic properties” of the construct. That’s because the way you choose to measure something can drastically change the properties of the variable in your research. For instance, say you design an experiment to find out the differences in grades between extroverted and non-extroverted people. In this case, you are conceptualising extroversion as a categorical variable (extroverted or non-extroverted). However, if I tweak the research question to this — does extroversion have an impact on a student’s GPA? In this case, I can correlate extroversion with a student’s GPA — meaning that I have now conceptualised extroversion as a continuous variable, rather than a categorical one.
I used the term correlate before I have formally introduced it — that’s on me. It’s not essential that you know what the term means yet, but what I wish to emphasise here is that the method you use for analysis hinges heavily upon the variable type that you have. As a result, a solid understand of your variable type is essential to choosing the appropriate analysis to support your hypothesis and answer your research question.
Side note: Psychology at NTU (and probably university in general?) focuses a lot on research methods. I realised that people reading may be confused as to why I am talking so much about researh methodology. At the higher levels, it’s not sufficient to just know about a theory. It’s essential to know how they proved the theory, and think critically about whether or not the evidence is truly strong enough to support the theory. Even in non-statistical modules, one of the most common assignments/group projects is just for you to choose an empirical paper of your choice regarding the module you took — and then present the paper to your class. This would require the whole story of what led to the research study, the methods of the study, what analyses they conducted, and what the implications of their findings are.
The Operationalisation Issue
So now that you have a basic understanding of variable types, let’s try to design a research study. We’ll use the example we used above — regarding extroversion and grades.
So, your constructs of interest are extroversion and grades. In order to design an experiment and prove your hypothesis of a relationship between them, you need some way to measure these broad level, abstract contructs. The act of finalising how you convert a theorectical, broad level contrsuct into a concrete, measureable variable, is known as the process of operationalisation.
There will always be a gap in your operationalisation. When measuring grades, GPA seems to be quite a good measurement as it is a direct measurement of the construct. The gap here is rather small — some may argue that “oh one semester’s grades is not as good as cGPA, or oh why are you only accounting for university grades, what about A levels etc etc”. But yea, in general this operationalisation seems quite strong.
Side note: yes, critiquing is part of the process, so basically almost everything you do can be subjected to scruity. As long as it’s defenable, you’re good.
But what about extroversion? How would you opertionalise this constuct? Now this gets a little bit more tricky, as the construct is not as “concrete” as is GPA. Typically extroversion is measured using established questionaires — but questionaires are by themselves not perfect too. There are multiple versions developed by different researchers, each of which have their own strengths and weaknesses (for instance, some may account for certain aspects of extroversion (say energy levels, frequency of going out), while others may not.
Especially in Psychology, where constructs are as not straightforward to measure (in contrast to say, weight), there is a hige emphasis on the validity of a measurment. Validity is a technical term that would require its own post to explain properly — but for now just know that it refers to the ability of your measurement to really measure what you are trying to measure (accuracy). This concept is related to your opertionalisation gap — if you choose a measurement that has low validity, your measurment will not measure your construct, and your operationlisation gap will be huge.
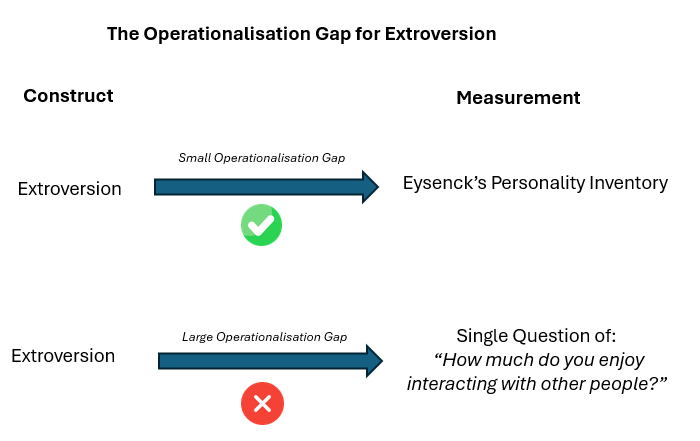
Back to the issue at hand — to give you an illustration of the operationalisation of the construct of extroversion, we will have two examples of operationalising it. Firstly, we will use the established Eysenck’s Personality Questionaire to measure extroversion, while in the 2nd scenario we will use a single question made up by me: “How much do you enjoy interacting with other people?”
Obviously, the established questionaire will have a smaller operationalisation gap as compared to my single question measurement. But do note that my measurement is not wrong — it is just not as strong. In fact, my question is in fact probably one of the questions asked in the Established Questionaire as well! It’s just that there are other aspects of extrovversion which I failed to capture in my single question — the measurement thus has low content validity (I’ll explain this next time), and thus has a huge operationalisation gap.
Choosing your Measurement Type for Analysis
When you get down into operationalising your variable, other consideration other than the operationalisation gap is also your research design/statistical analysis plan.
There are 4 types of measurement scales:
Nominal
Ordinal
Interval
Ratio
This information somewhat overlaps with the previous classification variables as categorical or continuous — but it provides more information than the previous classification.
Nominal scales are categorical ones where there is no order between the categories. Ethnicity would be a good example of this — typically in analysis we recode the variables, say Chinese = 1, Malay = 2, and Indian = 3. There is no order between the the values of the variable (chinese/malay/indian), and thus this measurement uses a nominal scale.
Ordinal scales are somewhere in between categorical and continuous — the key is that there is now an order to your values. For instance, if a question asks you to rank which drink you would like from most to least desired — say coke, pepsi, or sprite. If your response is sprite > pepsi > coke, sprite would be coded 1, pepsi would be coded 2, and coke would be coded 3. In this case, the values of 1,2,3 are not just group labels — they also provide information about the order of which things are desired. Values in order scales need to be interpreted relative to each other.
Side note: Likert scales are the fuzzy in between between ordinal scales and interval scales. Likert scales are the scales which ask you to rate how much you agree/disagree, like/dislike something on a scale of 1 to 5. You probably have seen this in toilet surveys — where they ask you how satisfied you are with the cleanliness. Strictly speaking, it is a ordinal scale since there the values depict an order of satisfication, with no guarantee that the intervals between the values will be constant. However, there is evidence to support that you can treat it as an interval scale, especially under certain situations. Most psychological studies do in fact treat it as an interval scale.

Interval scales fall into the continuous variable category — and from now on the measurements can be described as quantitative. Interval scales are ordinal scales, except that now the distance in between each value is constant. Going back to the drink preference example, in the previous ranking exerise when you ranked sprite > pepsi > coke, you may like sprite a lot more than you like pepsi, whereas you only like pepsi marginally more than you like coke. This is because in ordinal scales, the interval between the values is not constant. However, for interval scales, the interval needs to be constant — an example will be temperature scales like celcius or fahrenheit, whereby the the each degree of celcuis/farenheit change represents the same distance — regardless of the the exact temperature at the time (the distance from 1 to 2 degrees celcius is the same as the distance from 99 to 100 degrees celcius).
Ratio scales are interval scales with a true zero. Naturally, they fall into the continuous variable category as well. They are termed ratio scales because with these scales, ratios make sense (you need a true zero for this!). Some examples would be height or weight. It makes sense to say that 2kg is twice as heavy as 1kg, or 3 meters is thrice as tall and 1 meter. However, it does NOT make sense to say that 10 degrees celcius is twice as hot as 5 degrees celcius — simply because the celcius scale is not a ratio scale. If you want to compare temperatures like that, you need the ratio scale for temperature — the Kelvin Scale. In this can, then you can say that 10 Kelvin is twice as hot as 5 Kelvin.
Side note: Yes, some temperature scales (celcius/fahrenheit) are interval, while others (kelvin) are ratio. Not all temperature measurement scales are made the same!
Consolidating your Knowledge
Great! You now know a little bit more about how variables are classified in research. You have the continuous/categorical classification, and also the nominal/ordinal/interval/ratio classification.
What I wish to highlight is that the nominal/ordinal/interval/ratio classification is typically used to describe the measurement scale, rather than the variable (which is typically described in terms of continuous/categorical). However, these two classifications are naturally related (extroversion can be a categorical/continuous variable, depending on your measurement scale), and thus a good understanding both terminologies is important. They are something thrown around as though they are equivalent — and true, with the measurement scale you can get a good idea of how the authors conceptualised their variables, but still — take shortcuts only after you know what you are doing hahaha.
In the next post, I will use the knowlege you learnt from here to properly design a research study. Stay tuned for that!
Image References
<a href=”https://www.flaticon.com/free-icons/good" title=”good icons”>Good icons created by sonnycandra — Flaticon
<a href=”https://www.flaticon.com/free-icons/delete" title=”delete icons”>Delete icons created by Pixel perfect — Flaticon
<a href=”https://www.flaticon.com/free-icons/smiley" title=”smiley icons”>Smiley icons created by hqrloveq — Flaticon
<a href=”https://www.flaticon.com/free-icons/neutral" title=”neutral icons”>Neutral icons created by LSEdesigns — Flaticon
<a href=”https://www.flaticon.com/free-icons/sad" title=”sad icons”>Sad icons created by hqrloveq — Flaticon